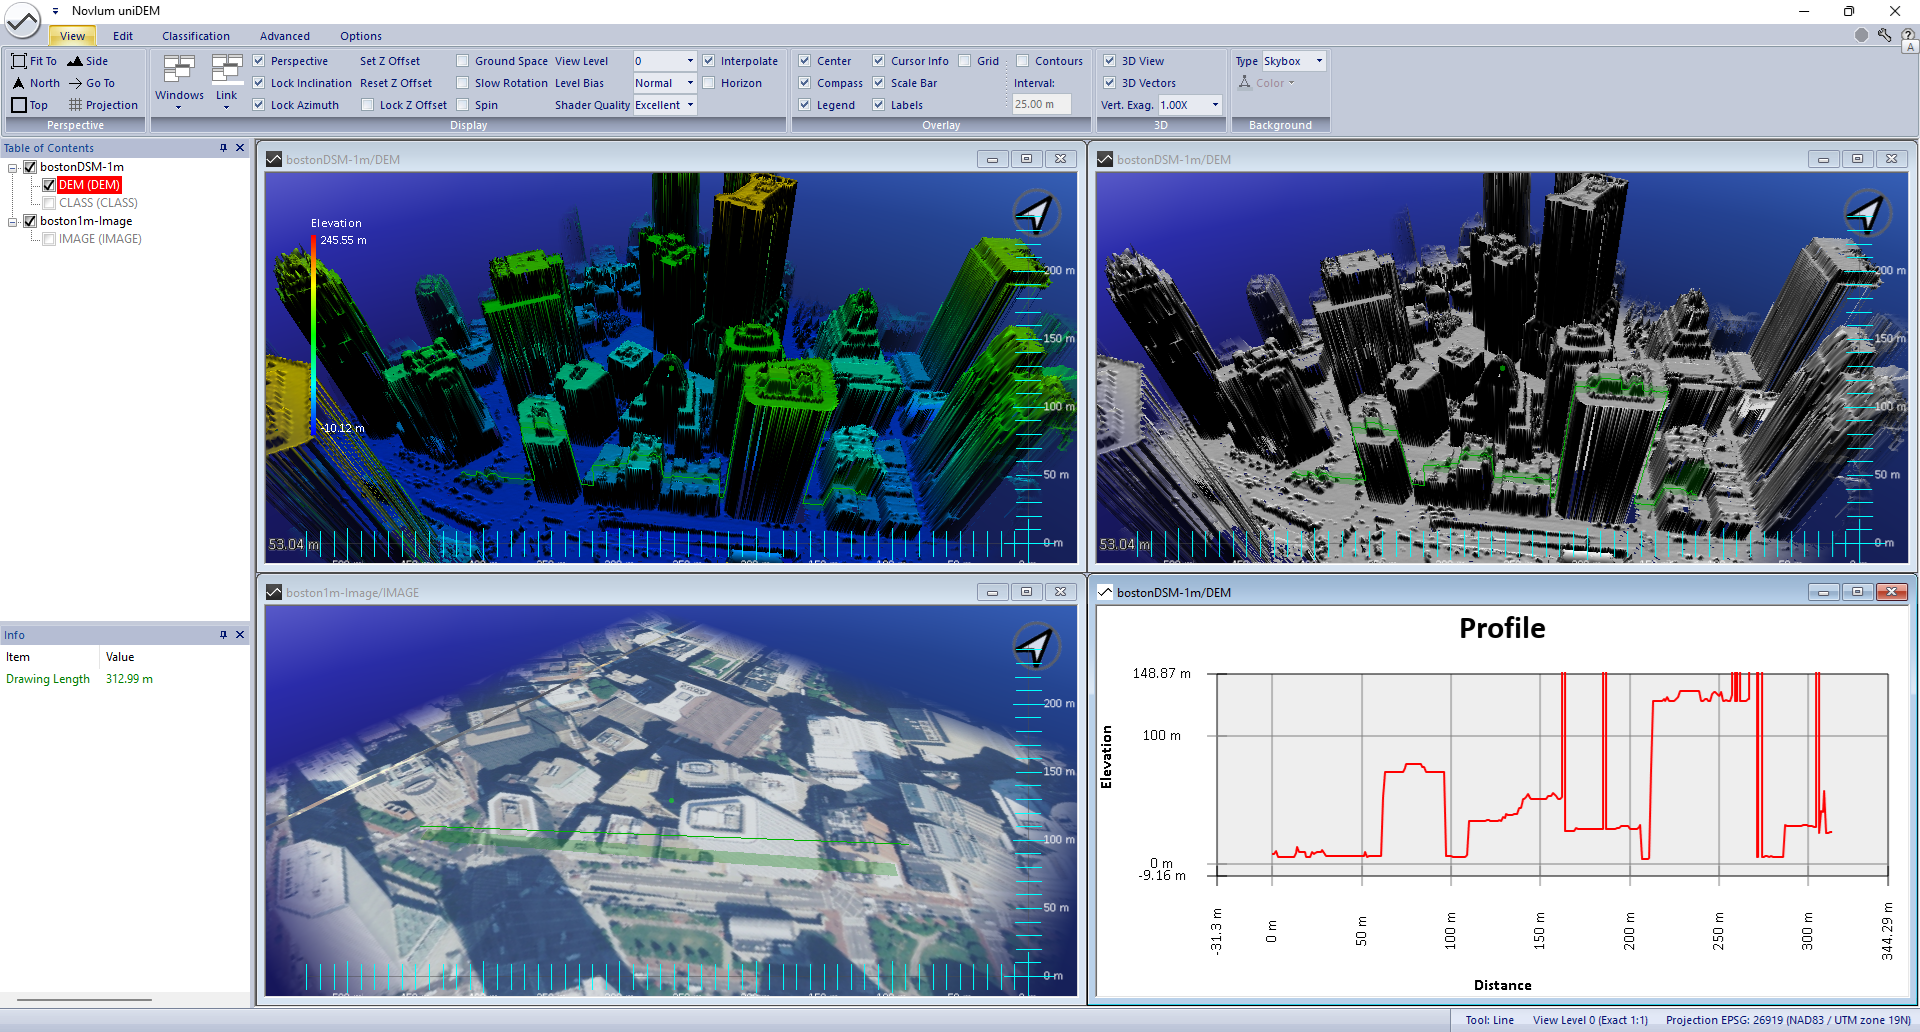
Visualization of data in 2D and 3D with real-time interaction at the touch of a mouse
Instant display of DEMs, images, Point Clouds, and masks (vectors) in up to 12 windows simultaneously
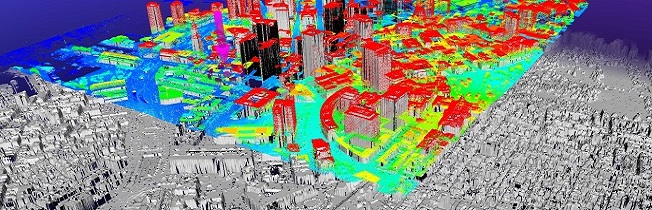
DEMs can be overlaid with images and masks by displaying in the same window
Windows can be linked/unlinked
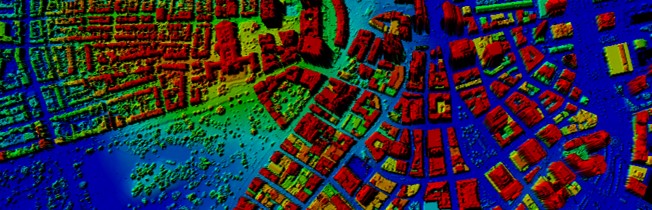
Grayscale shaded relief and color elevation shaded relief
Contour lines (generated on-the-fly) overlaid on DEM
Displayed views can be exported and saved
Basic Tools and Functions for 3D Data Handling
Drag and drop data into a project
Reprojection on the fly if handling data with different projections
Save and export intermediate versions of edits
Measurement tools reporting length, area, etc.
Edit of shapefiles and modification of polygons
Integer to float conversion and vice versa
Calculation of statistics and histograms
Surface differences with multiple DEMs
Manipulation and Analysis of DEMs
Automated and semi-automated selection tools
Artifact removal tools
Several void filling methods: Interpolation of small voids and filling void with DEM of another source (Delta Surface method)
Correction and adjustment tools for DEMs: Raise values below zero above zero, set elevation manually to specific value and
shift elevation of a whole area
Various filters to reduce noise in the DEM dataset
Interactive terrain manipulation for constructing structures (e.g. dams, roads, small drainages)
Flood Fill tool to select areas in DEMs, imagery or masks automatically
Automated river centerline detection
Hydrological editing tools including flattening of water bodies, stepping of rivers
Infrastructure editing including flattening of roads, runways etc.
Automated road network delineation
Automated bare-ground classification
DTM creation
Math operations: statistics, difference, slope analysis, maximum and minimum analysis

 uniDEM