About Us Customers

 uniDEM

Tutorials
User Manual

Selecting DEM areas to edit using uniDEM

In this tutorial you will learn how to select areas using different selection tools and options.

To edit a DEM, it is necessary to define the areas to be modified by selection. This is done to restrict modifications to areas in need of correction thereby avoiding unwanted changes to the DEM.

Selections are made by choosing a selection tool (polygon, line, rectangle, floodfill) and clicking on the displayed data set while holding the shift key and left mouse button concurrently.

The selection of an area can be performed on any loaded and displayed raster data set. Subsequent editing operations will only be applied to the DEM where selections are made.

Sample Data

The sample DSM used in this lesson was generated at 1 meter spacing from LIDAR data available from the USGS as part of the 3DEP program. It covers a small example area of downtown Boston, MA, USA.

Prior to commencing a project perform the following steps.

This lesson will take approximately 20 minutes.

1. Load and Display Data

Load and display DEM and ancillary data you want to use for editing the DEM from the unzipped sample data folder.

  1. Load DSM and imagery
    • Click the uniDEM logoLoad DEM
    • Navigate to the working directory
    • Select bostonDSM-1m.tif
    • Click the uniDEM logoLoad Image
    • Select boston1m-Image.tif
  2. Display DSM and imagery
    • Right click on bostonDSM-1m in Table of Contents and select Check All
    • Change color table:
      • Within the Options tab in the Shader panel, click the Color Scheme dropdown and select Topo
      • Within the Options tab in the Shader panel, click the Scope and select Custom
      • Set Min. to 0
      • Set Max. to 100
    • Press Ctrl-N to create a new window
    • Press Ctrl-T to organize the windows
    • Click into the right window
    • Right click on boston1m-Image in the TOC and select Check All
unidem selection tutorial

Help References:

Load DEM | Load Image | Shader Color Scheme | New Windows (Ctrl-N) | Tile Windows (Ctrl-T)

2. Selection with Drawing Tools

Drawing of polygons, rectangles and lines can be used to select areas or to modify an existing selection. The selection can be drawn over either the DSM or the imagery. It will appear in both windows.

  1. Press P to enable the polygon drawing tool (or: Within the Edit tab in the Tools panel, click the polygon drawing tool)
  2. Hold Shift+Left-Click on the mouse button to draw a polygon
  3. Hold Shift+Left-Click on the mouse button add additional points to the polyon.
  4. Press Shift+Plus key to add the drawing as a selection (or: Go to Edit tab in the Selection panel and press Add)
  5. Draw other polygons by holding Shift+Left-Click mouse button and Add them to the selection
  6. If a point in the polygon is set incorrectly while drawing it can be removed by pressing Shift+Backspace and the drawing can be continue
  7. To clear a selection press the Esc key

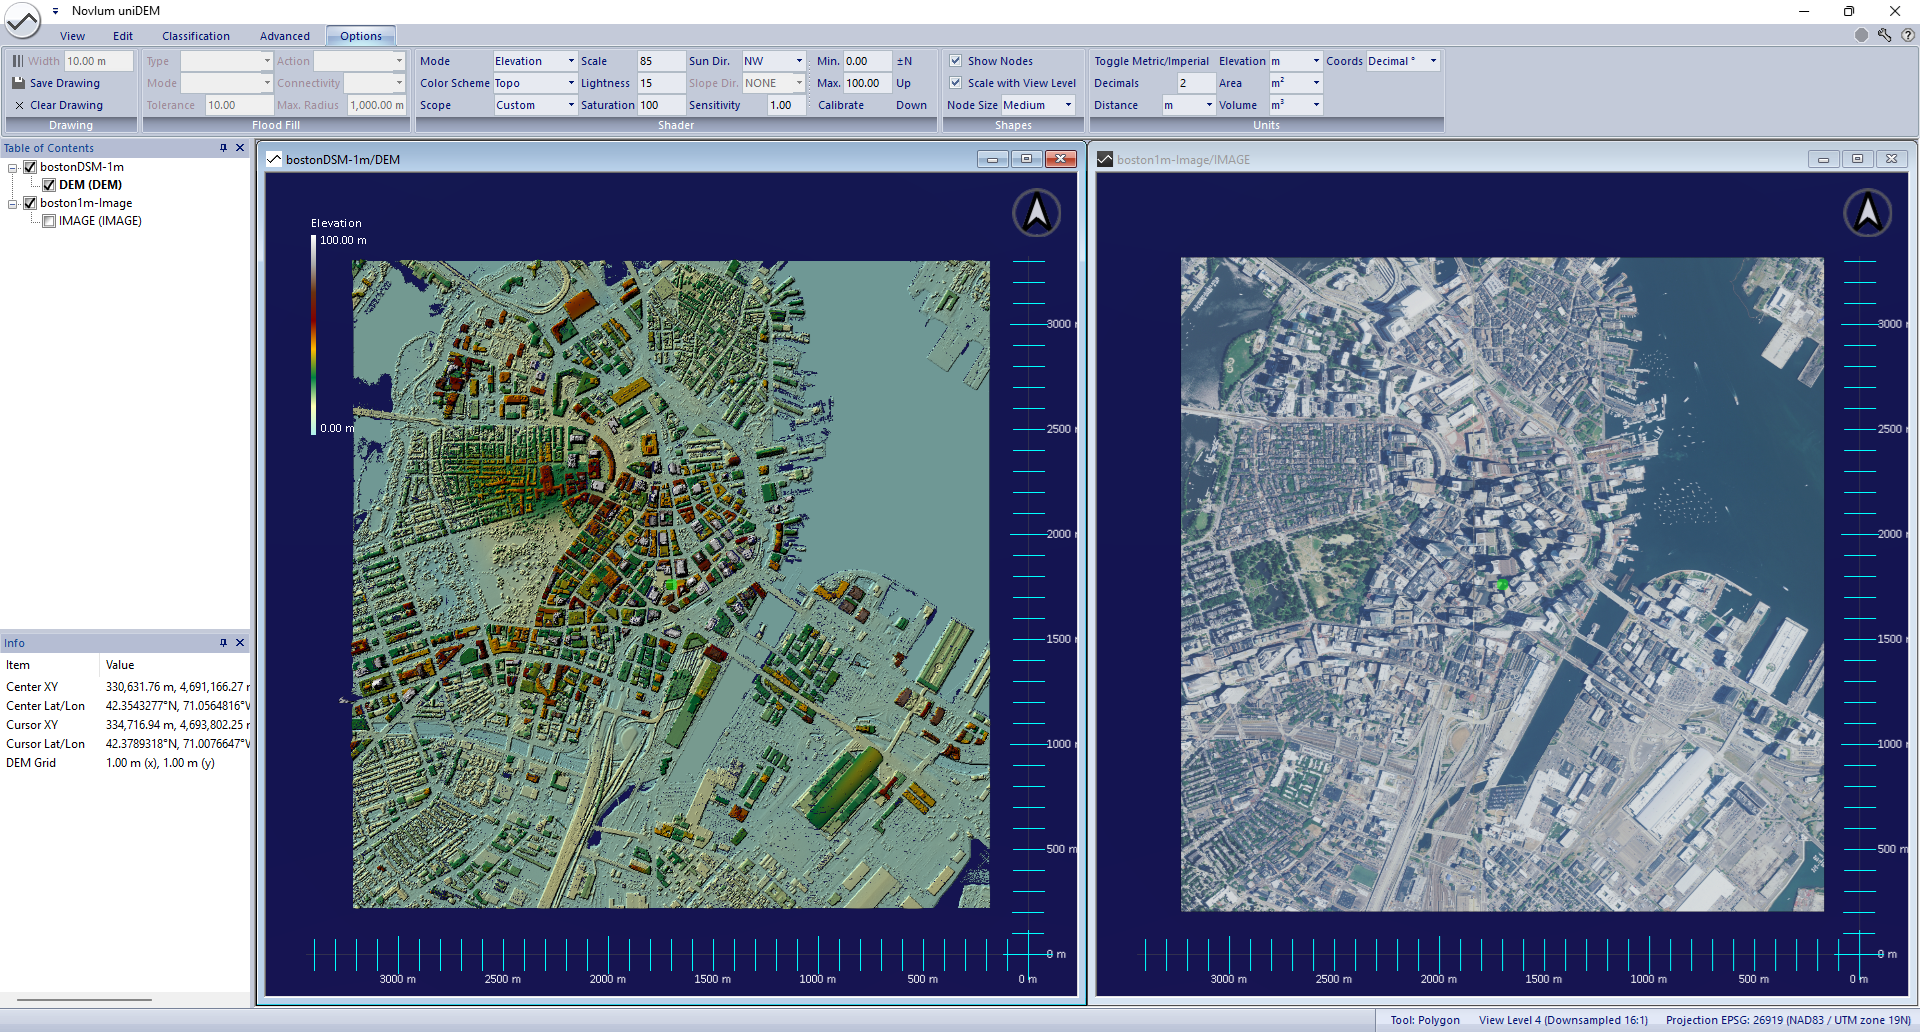
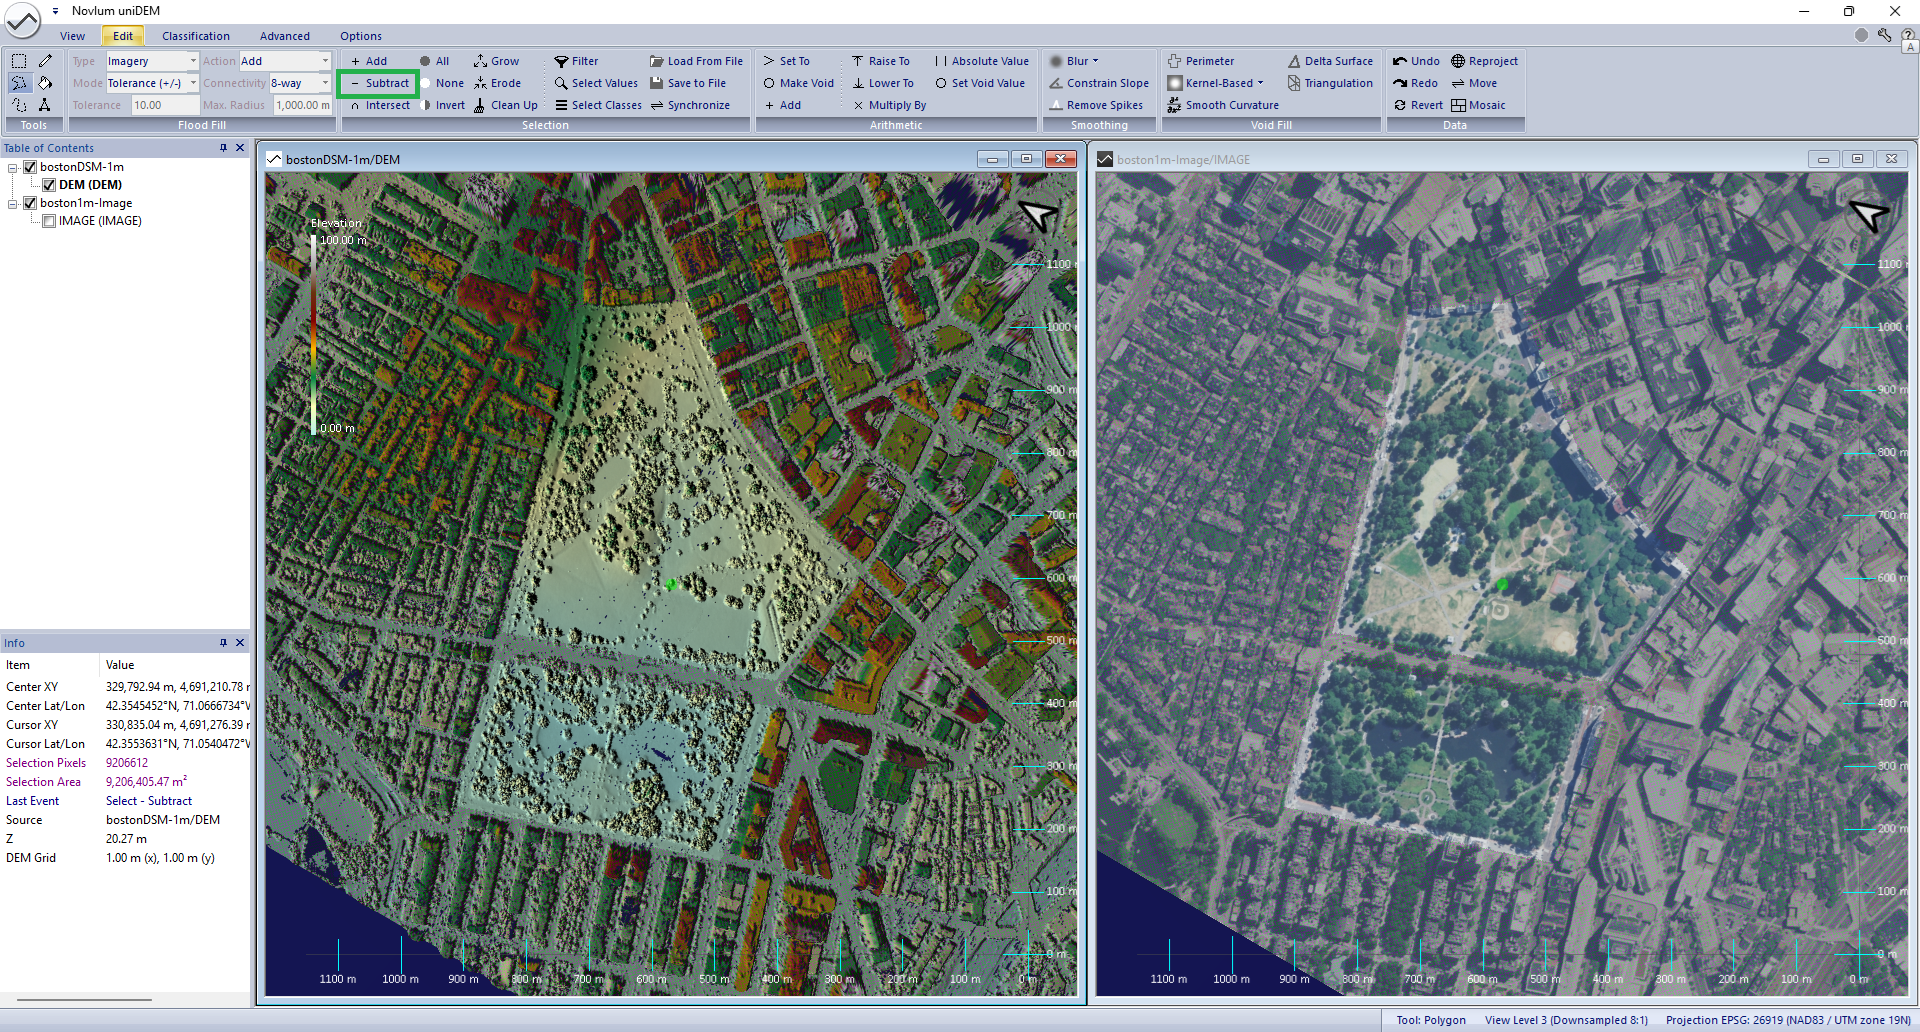
The picture below shows the displayed DSM and imagery of Boston downtown including selections over the public parks.

The selection of the two parks in the center (location: -71.0675680(°E), 42.3544870(°N)) appear in a checkered pattern over the data.

To center the dataset over the parks:
Go to the View tab in the Perspective panel and press Go To and enter the coordinates.
Zoom in with the wheel mouse.

The park along the river (upper left part of the area, cursor position) is just surrounded by a polygon but not yet added to the selection. It is highlighted in green and will appear checkered after pressing Add.

uniDEM polygon Selection

Help References:

Rectangle Selection Tool | Polygon Selection Tool

3. Selection with Flood Fill

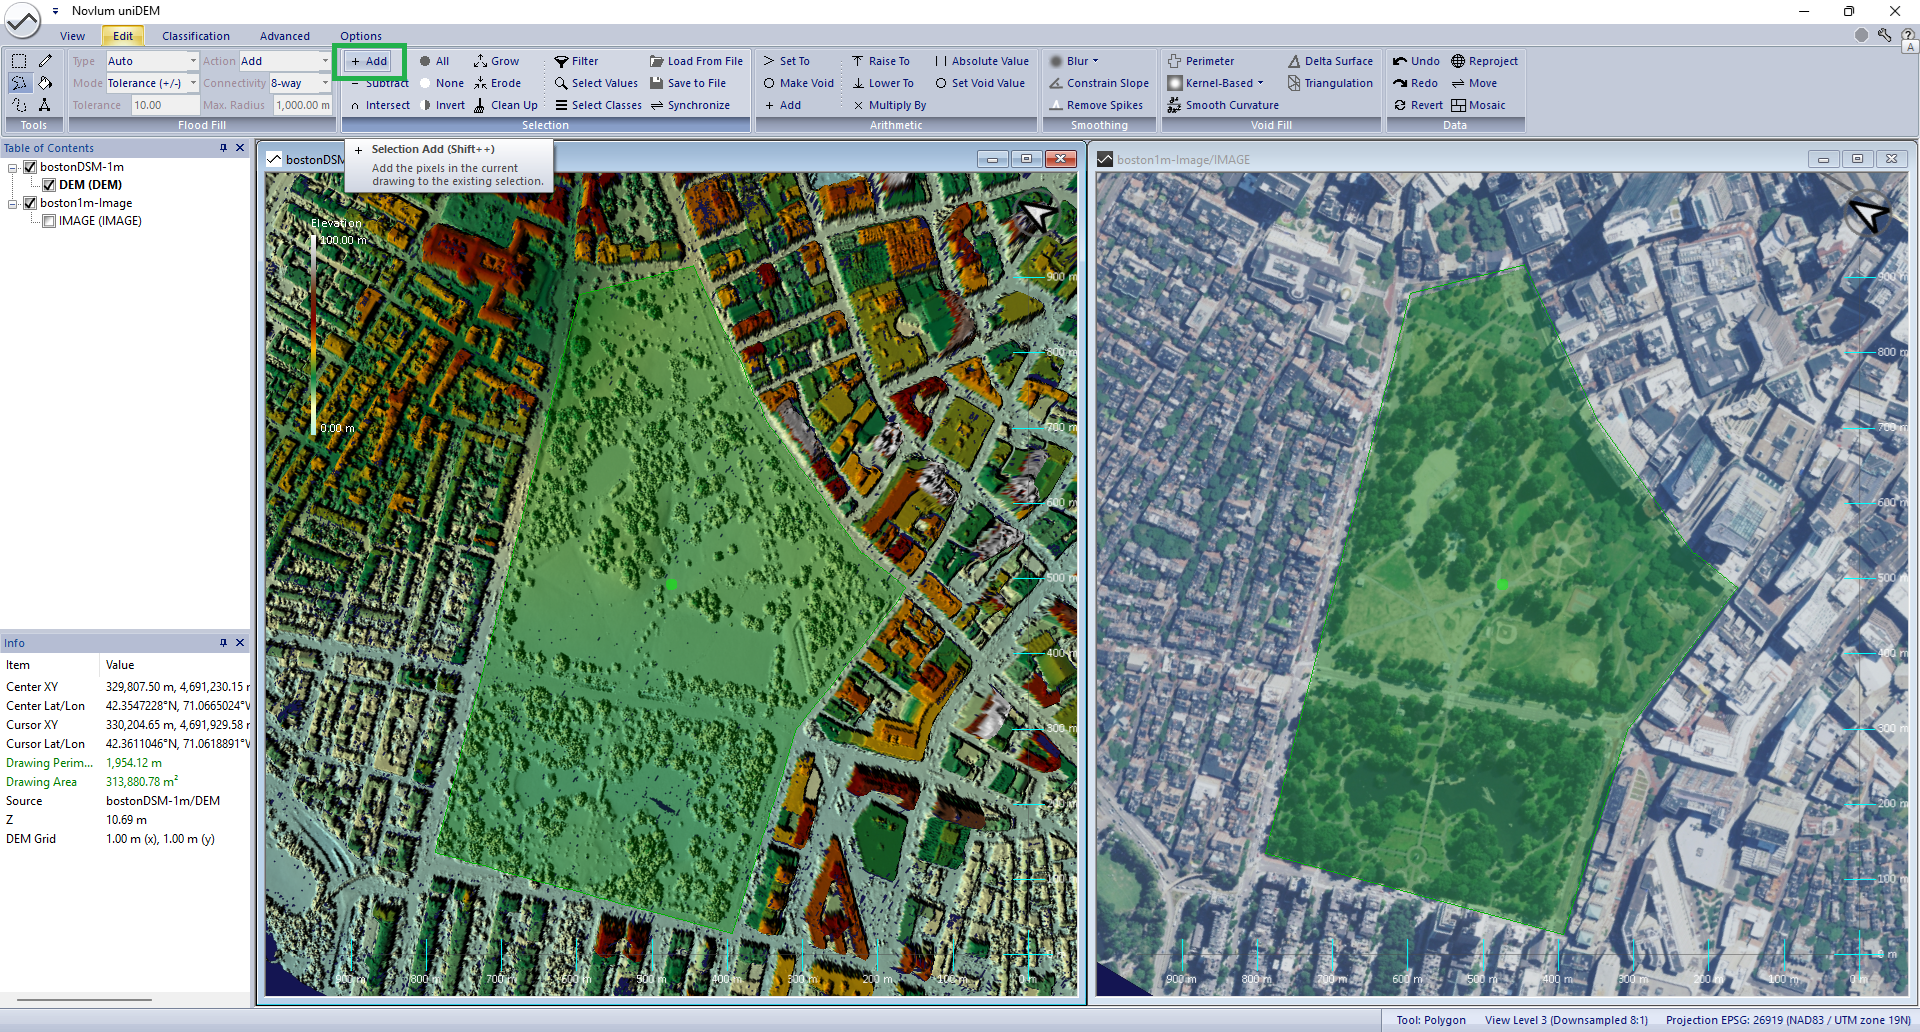
The Flood Fill Tool is an excellent, semi-automated tool to select large areas in a very efficient manner. Large areas of equal and similar pixel values can be selected by one click on the data layer being filled upon according to the parameters defined in the Flood Fill Options.

  1. Press F to enable the Flood Fill tool (or: Within the Edit tab in the Tools panel click the Flood Fill tool)
  2. Within the Edit tab in the Flood Fill Options panel, set the following selection parameters:
    • Type: select Imagery as the raster layer used for the filling
    • Mode: select Tolerance (+/-)
    • Tolerance: use 10. This selects all connected pixels with pixel values of +/-10 of each R,G,B channel.
    • Action: select Add. Result will be added to any existing selection or a new selection will be created.
    • Connectivity: select 8-way
    • Max. Radius: enter 1000.00 m to select all similar pixels within a radius of 1000.00m
  3. Press Shift+Left-Click on an area of similar color in the imagery, e.g. water, and the area around the pixel you clicked on will be selected.
  4. Repeat last step until all water areas are selected

The picture shows the cursor positions where the first mouse click was done and the area which was filled accordingly.

Selection by Flood Fill

Help References:

Floodfill Selection Tool | Floodfill Options

4. Select All and Clear a Selection

Select All

To selection the the whole dataset area press Ctrl-A

Clear Selection

To clear a selection press Esc.

To clear only a drawing but leve the selection press Shift + Esc.

To undo the last selection (or any operation) press Ctrl-Z.

Help References:

Select All (Ctrl-A) | Clear Selection (Esc)

5. Exclude Area from Selection

Areas can be excluded from selections. This is of interest in case of modification of an existing selection or as a step in the selection process when e.g. the whole data set is selected first followed by the exclusion of specific areas.

To exclude an area from the selection of the whole data set:

  1. Press Ctrl-A to select the whole data set
  2. Press P to enable the polygon drawing tool
  3. Hold Shift+Left-Click mouse button to draw a polygon around the area to be excluded
  4. Press Shift+Minus key to exclude the drawing from the selection (or: Within the Edit tab in the Selection panel, and click Subtract)
  5. Press Shift+Esc to clear the drawn polygon, but maintain the selection

The picture below shows the result of public park areas excluded from the selection of the whole Boston data set. The two parks in the center are cleared from the selection. The park along the river (upper left part of the area, cursor position) is just surrounded by a polygon but not yet subtracted from the selection and is highlighted in green. It will be cleared from the selection after pressing Subtract.

Exclude from Selection

Help References:

Polygon Selection Tool Add Selection | Remove Selection

6. Selection by Pixel Value

Selection can be made based on pixel values or elevation values. This can be used to select all regions of values within a range.
To identify missing pixels, "no data" and "invalid data" (voids) a specific pixel value or a range of values can be selected.
In the following example, all "no data" areas will be selected under the assumption that the pixel value is unknown. Usually, the pixel value of "no data" is -32767.0 or -9999.0.

  1. Within the Edit tab in the Selection panel, click Select Values
  2. Set the following parameters in the dialog windows and press Ok:
    • Select data set: bostonDSM-1m
    • Select data: DEM
    • Enter comma separated ranges for values to select (e.g. 1,2-3,5): Ex. -100000--500

The picture shows all selected voids as the checkered pattern over water and land.

Select Value

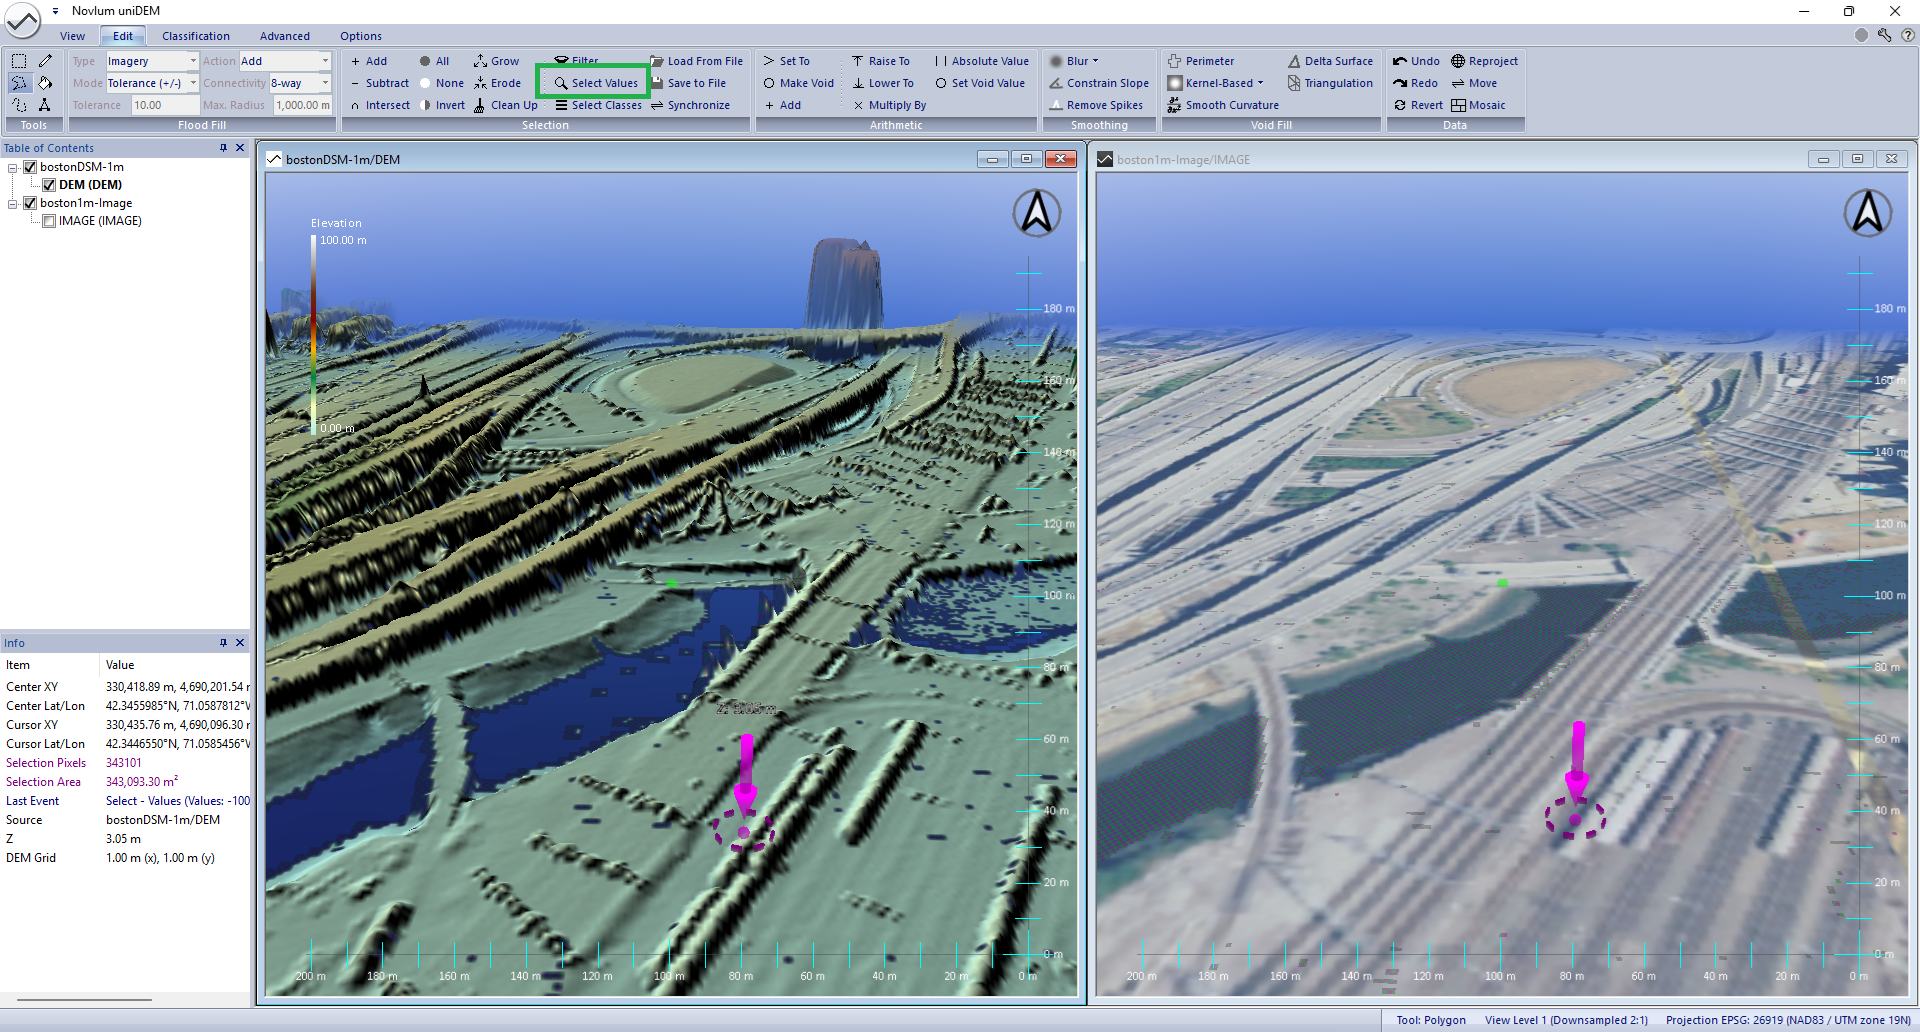
The voids can be filled in a further process step. E.g.:

  • Within the DEM tab on the Void Fill panel select Kernel → Inverse Distance Weighted to fill small voids by interpolation
  • Within the DEM tab on the Void Fill panel select Triangulation to fill larger voids

Help references:

Select Values